Solutions Engineer
Oct 14, 2022 | 7 mins read


Cloud-native, microservices, CI/CD, DevOps, and Infrastructure-as-Code (IaC) are all popular buzzwords in the post-COVID-19 era, where organizations are leveraging the rapid pace of technological developments, driving sustainable economic growth to recover from the onslaught of the COVID-19 pandemic.
The first chapter of the 2022 World Bank Report describes how the pandemic “sent shockwaves through the world economy and triggered the largest global economic crisis in more than a century.”
Despite being challenging to acknowledge, new technologies, specifically cloud-native technologies, developed rapidly as a result of shelter-in-place regulations and the desperate need to keep the global economy afloat. Due to the requirement for remote work, digital collaboration, and business continuity, organizations have embraced cloud-native technologies and modernized their IT infrastructures.
Containerized applications comprising microservices, API gateways, containers, service mesh, and an orchestration platform are all part of this "new" cloud-native model. Although Kubernetes, the most popular orchestration platform, seems to wave a magic wand and automate the deployment, scaling, coordination, and maintenance of containerized applications, there is still a significant need for human intervention, particularly when things go wrong.
Therefore, let’s look at ways to troubleshoot applications running on Kubernetes with the starting point being how to monitor a Kubernetes deployment.
Observability: The Starting Point for Troubleshooting Kubernetes Applications
The research paper titled “Enhancement of Observability Using the Kubernetes Operator” describes the imperative of observability as a critical concept in cloud-native application development and operations, especially in complex distributed systems like those managed by Kubernetes.
What is observability, and how does it relate to this article’s topic: Monitoring and troubleshooting applications running on Kubernetes?
When answering these questions, the drop-off point is to define the term “observability.”
What is Observability?
The authors of the above-mentioned research paper define observability as:
“The ability for us to monitor the state of a system [or cloud-native application], which involves monitoring standard metrics like CPU utilization, memory usage, and network bandwidth.”
Succinctly stated, the more information we are provided about the state of an application, the more we can improve the application’s performance by recognizing, troubleshooting, and removing unwanted behaviors.
Observability: Monitoring & Troubleshooting Kubernetes’ Applications
Observability is a fundamental concept in monitoring and troubleshooting Kubernetes applications. It involves collecting, analyzing, and interpreting data from multiple sources within a Kubernetes cluster to gain insights into the behavior and performance of applications. Observability helps DevOps teams understand what’s happening within the system, diagnose issues, and ensure the reliability of their applications.
It is reasonable to assume that the observability model comprises two main components: monitoring and troubleshooting.
Monitoring
The monitoring component of the observability model is divided up into four elements:
- Metrics: This segment collects and analyzes metrics like CPU usage, memory consumption, network traffic, and custom application-specific metrics.
- Logs: The logs element aggregates and analyzes logs from different pods, containers, and components, providing the necessary information to track events, identify errors, and understand the application’s execution flow.
- Distributed Traces: Distributed tracing allows you to visualize and analyze the flow of requests across multiple services and microservices, helping pinpoint bottlenecks and latency issues.
- Events: Kubernetes events provide information about changes and state transitions within the cluster, facilitating an understanding of resource behavior and potential problems.
Troubleshooting
The troubleshooting component assists in identifying and resolving the following issues:
- Anomaly Detection: Monitoring observability data allows you to identify anomalies in metrics, logs, and traces, helping you to detect unusual behaviors that might indicate issues.
- Alerting: Setting up alerts based on predefined thresholds or anomaly detection helps notify the operations team about critical issues that require attention.
- Root Cause Analysis: Observability data enables deep investigation into incidents by tracing back to the root cause, often combining metrics, logs, and traces to understand the context.
- Performance Optimization: Through analyzing metrics and traces, you can identify performance bottlenecks, optimize resource allocation, and enhance application efficiency.
- Scaling Decisions: Observability insights inform scaling decisions, such as when to scale pods or nodes based on resource usage patterns.
The Observability Model and Kubernetes Operators
However, the observability model can quickly become very complex due to the vast amount of data generated across different areas of the Kubernetes cluster. Simplification and automation are key to managing this complexity and ensuring efficient observability.
By way of solving this challenge, the research paper cited at the top of this discussion provides a useful answer to this challenge: by building a Kubernetes Operator.
What are Kubernetes Operators?
At this junction, it is important to note that Kubernetes is based on two fundamental principles:
- A simple and flexible design
- The ability to automate as many processes as possible.
These principles not only make Kubernetes useful in a wide variety of contexts and applications, but they also limit its original features to specific commands and operations exposed via APIs. Thus, these commands and operations must be extended to perform more complex actions, resulting in more sophisticated automations.
Enter Kubernetes Operators.
The Cloud Native Computing Foundation (CNCF) describes Kubernetes Operators as follows:
“Kubernetes Operators are software extensions that make use of Kubernetes APIs to extend behavior… [In other words] Operators are patterns that extend the behavior of the cluster without changing the Kubernetes code.”
Kubernetes Operators: Declarative vs. Imperative
In order to gain an in-depth understanding of Kubernetes, especially how to build an Operator, it’s vital to understand the difference between the declarative and imperative approaches as they are used in various contexts, including software development, configuration management, and system administration.
Declarative Approach
Declarative programming describes the desired outcome or state of a system/application without specifying the exact steps to achieve it. In essence, declarative code provides a high-level description of what the system must look like or what must be done, often coded as a configuration or specification.
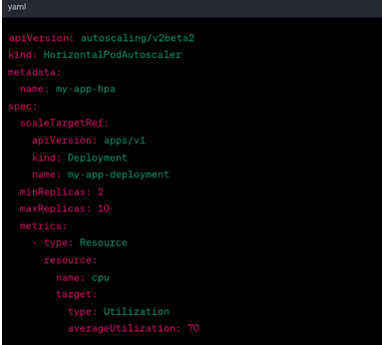
A good example of declarative programming is found in the Kubernetes Horizontal Pod Autoscaler (HPA). This code snippet creates an HPA in YAML using a declarative approach. In other words, it describes the HPA’s state or what it should look like at any given moment.
The most important points to bear in mind when considering adopting a declarative approach are:
Automated Management: Declarative systems, like Kubernetes and configuration management tools, automatically interpret and execute the code to achieve the desired state.
Consistency and Idempotence: Declarative code typically ensures consistency and idempotence, meaning that applying the same configuration multiple times results in the same outcome.
Note: Declarative programming is commonly used in infrastructure-as-Code practices, defining infrastructure through code.
Imperative Approach
On the other hand, imperative programming focuses on providing explicit instructions or commands to achieve specific tasks or outcomes, such as writing a software application. Imperative code includes detailed step-by-step instructions that specify the exact sequence of actions to be taken.
These tasks often require the manual execution of each step, giving the developer more direct control over the process. However, executing the same imperative code multiple times might lead to different outcomes, depending on the context or external factors. Finally, imperative programming offers greater customization and fine-grained control over individual tasks and actions.
In summary, there is room for both approaches. The choice between declarative and imperative depends on the context, goals, and tools you are working with. Declarative approaches are often favored for their automation, consistency, and suitability for system management and configuration. And in the context of this discussion, declarative programming is required to build a Kubernetes Operator.
Kubernetes Operators: Function and Purpose
Kubernetes Operators are similar to automated software for system administration.
The CNCF article cited above describes the quintessential nature of an Operator:
“We can think of an Operator as an “expert”. We show it what we want and with what tools, and then it works tirelessly to achieve that goal.”
Therefore, Operators are declarative rather than imperative because we define desired objectives and resources. The Operator then takes this declarative code and continuously monitors the system, adjusting it as necessary, keeping it as close to the desired state as possible.
Implementing the Observability Model with Kubernetes Operators
Implementing the observability model for containerized applications with Kubernetes Operators involves creating custom resources, controllers, and automation logic to deploy, configure, and manage observability tools and data collection within your Kubernetes cluster.
Here is a step-by-step guide to implementing the observability model using Kubernetes Operators:
1. Choose Observability Tools
Select the observability tools you want to use, such as Prometheus for metrics, Grafana for visualization, and Fluentd for logs.
2. Define Custom Resource Definitions
Create Custom Resource Definitions (CRDs) to define your selected observability tools.
CRDs in Kubernetes are a powerful feature that allows you to extend the Kubernetes API and create custom resources. You can define new object types and their specifications, which can then be managed and operated by Kubernetes similar to primitives like Pods, Services, and Deployments.
3. Develop Custom Operators
Create custom Operators for each observability tool. These Operators will watch for changes to the custom resources and take actions to ensure the application’s desired state.
4. Implement Logic in Custom Operators
Add the following logic to each Operator:
- Deploy the observability tool components (like Prometheus Server or Grafana Pods).
- Configure data collection and scraping targets.
- Set up visualization dashboards and panels and Grafana.
- Manage log aggregation, parsing, and forwarding with Fluentd.
- Enable tracing and set up spans for distributed tracing tools.
5. Automation and Reconciliation
Leverage the Kubernetes reconciliation loop pattern to maintain the actual state aligned with the desired state in the custom resources.
6. Integration and Data Collection
Integrate these observability tools with your containerized application:
- Configure Prometheus to scrape metrics from your app.
- Set up Fluentd to collect and forward logs from containers.
- Implement distributed tracing.
7. Testing and Validation
Thoroughly test the Operators with various scenarios to ensure they deploy and configure observability tools as expected.
8. Documentation
Provide clear documentation on creating custom resources (Operators and CRDs), deploying observability tools, and integrating them with your application.
9. Deployment and Distribution
Package the custom Operators and CRD definitions into deployable artifacts. Distribute these artifacts to your Kubernetes cluster or repository.
10. Monitoring the Observability Tools
Implement monitoring and alerts for the observability tools to ensure they are operational.
11. Continuous Improvement
Regularly update these Operators and observability configurations to support new versions of tools and accommodate changes in Kubernetes or your application.
In Conclusion
Implementing the observability model in a Kubernetes cluster is mandatory as it
gives DevOps teams high visibility into the application’s performance while
alerting and visualization ensure high availability by troubleshooting and
solving errors on time.
Using Kubernetes Operators as the vehicle to implement the observability model vastly improves application robustness, flexibility, scalability, and usability, leveraging sustainable economic growth as the world continues to digitize.